A port can look calm in a photograph and still be three days behind. That is why congestion reports matter: they turn a vague sense that “things are slow” into signals you can act on. The trouble is that many reports bury the useful numbers under a wall of vessel names and terminal codes. Read them in the right order, though, and they become a working tool for booking space, setting delivery windows and warning customers before a delay becomes expensive.
This checklist covers seven metrics worth checking every time. You do not need all seven to be perfect. You need to know which ones are moving in the wrong direction, and whether the movement is serious enough to change your plan.
Start With Waiting Time and the Vessel Queue
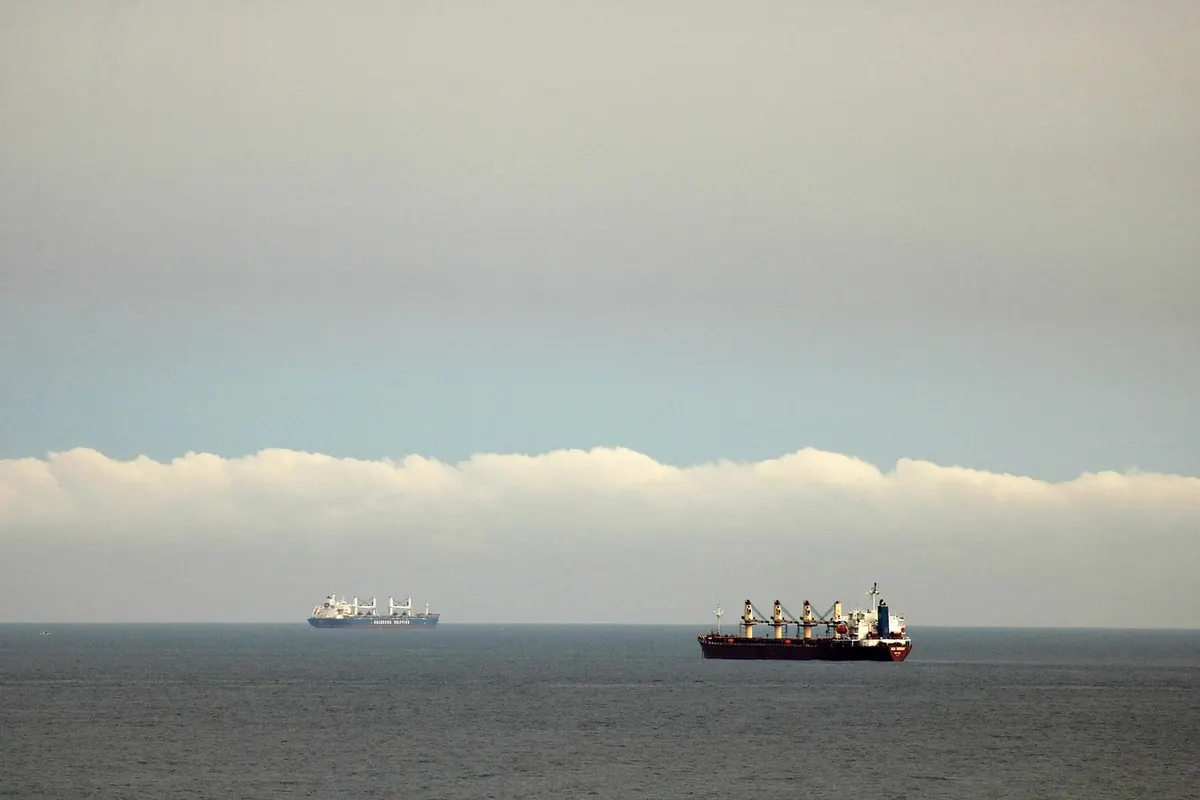
Metric 1: Anchorage waiting time. This is the first number most shippers look for, and the one most often misread. A report that says “waiting time: two days” is only useful if you know where the clock starts and stops. Is it counted from arrival at the anchorage, from pilot boarding, or from the moment a berth is nominated? For planning purposes, the number that matters most is arrival-to-berth: how long a vessel actually waits before cargo operations begin.
Look for the trend as well as the headline. A two-day wait that has been stable for a month is a different problem from a two-day wait that was half a day last week. If your carrier’s vessel is already in the queue, ask for the updated estimated time of berthing, not just the estimated time of arrival. Those two dates can drift apart quickly.
Metric 2: The vessel queue. The count alone tells you little. Ten feeder vessels clearing in a day is not the same as ten deep-sea ships carrying thousands of containers each. Check the composition of the queue: vessel size, service type, and how many are already working versus still waiting. A queue made up mostly of ships that have just arrived is less worrying than a queue of ships that have been sitting for a week.
Queue and waiting time should be read together. A long queue with high berth occupancy can be self-reinforcing: ships wait, berths stay full, and the next arrivals join the line. If both numbers are rising, build more buffer into your booking and delivery plans.
Read Berth Occupancy With Berth Productivity
Metric 3: Berth occupancy. This is the share of available berth time that is actually used. High occupancy is not automatically bad. It can mean a terminal is busy and well utilised. The warning sign is sustained occupancy near capacity while the vessel queue grows. That combination suggests there is little slack in the system, so a single crane breakdown or spell of bad weather can push delays through the whole schedule.
Check what the occupancy figure includes. Does it count maintenance time, idle periods, or weather stoppages? A terminal that reports high occupancy but short waiting times may simply be working efficiently. A terminal that reports high occupancy and falling productivity is a different story.
Metric 4: Berth productivity. Look for moves per crane hour, gross moves per hour, or a similar measure of how quickly cargo is handled once a ship is alongside. Compare the terminal with its own recent baseline rather than with a completely different port. A drop in productivity while occupancy stays high is a red flag: the berth is full, but cargo is not moving through it as fast as usual.
For shippers, this is where booking decisions get practical. If productivity is slipping, add a few days to your expected availability date before you promise a delivery slot to a customer. If you are choosing between two ports, do not compare waiting time alone; compare waiting time, occupancy and productivity as a set.
Container Dwell Time Deserves a Second Look
Metric 5: Container dwell time. Dwell time measures how long containers sit in the terminal before they leave, or how long export boxes wait before loading. Read import and export dwell separately. A single average can hide a long tail: most boxes may move quickly while a small group sits for weeks, blocking yard space and slowing everything else.
If the report offers a median or a high-percentile figure, use it. A rising import dwell time can mean customs clearance is slow, truck appointments are scarce, or consignees are using the terminal as free storage. A rising export dwell time can point to late arrivals by shippers, rail gaps, or empty-container problems. For your own planning, pre-clear customs where possible, book truck appointments early, and avoid treating the terminal as a warehouse. Dwell time is a symptom, not a diagnosis, but it is a useful one.
Yard Utilisation Shows Where the Pressure Is Building
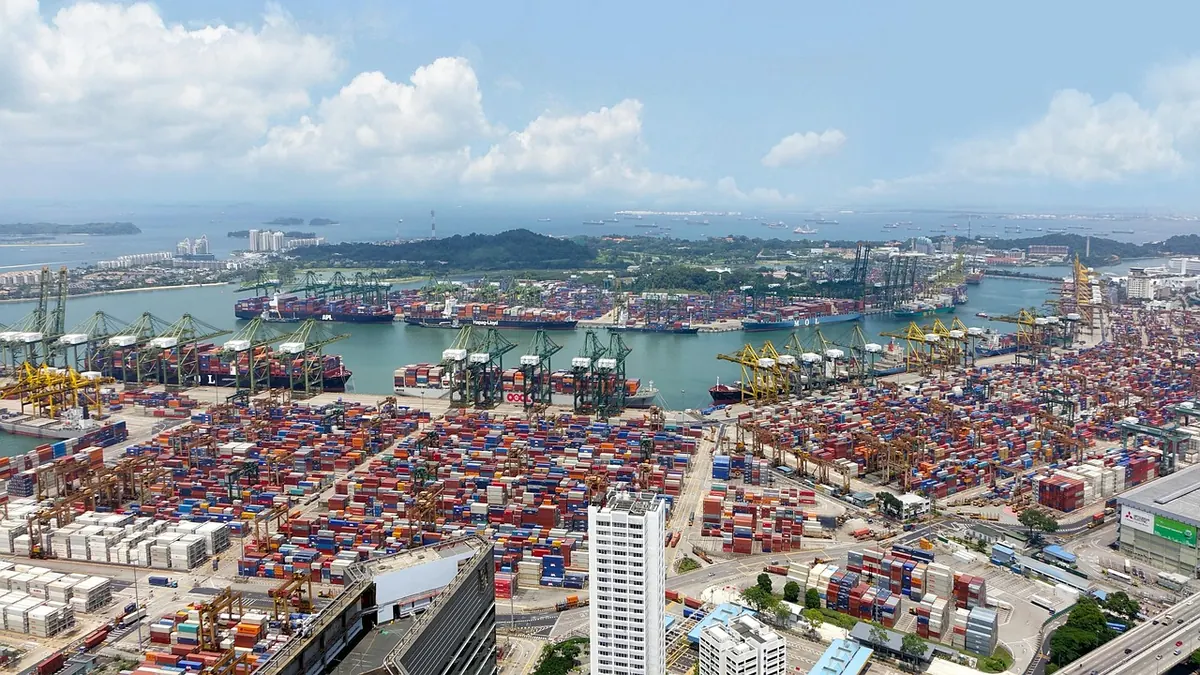
Metric 6: Yard utilisation. This is the share of terminal yard capacity in use. High yard density slows gate operations, rail loading and empty-container handling. Look at the split between import, export and empty containers if the report provides it. A yard packed with empties can still cause delays for export shippers who need a box, even if import cargo is moving well.
When yard utilisation is high, confirm empty return rules and appointment availability before you dispatch a truck. If you are moving cargo inland, check whether rail or truck capacity is keeping pace with the yard. A terminal can have short vessel waits and still be a difficult place to pick up or drop off a container.
Do Not Stop at the Gate: Inland Turnaround Matters
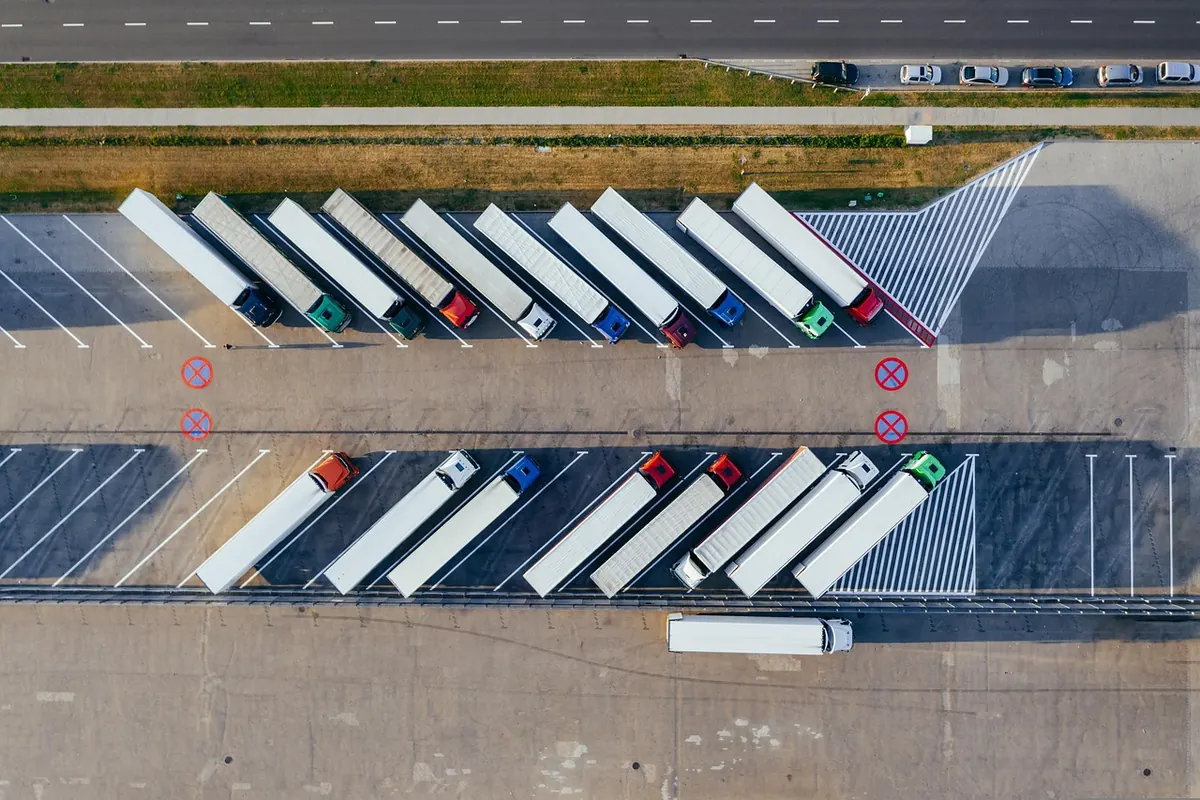
Metric 7: Inland turnaround. Port congestion does not end at the terminal gate. Truck turn time, rail dwell and chassis availability determine how quickly your cargo actually reaches the warehouse or rail ramp. A port with a modest anchorage wait but long truck queues can still delay your delivery by days.
Read these figures alongside your own delivery schedule. If truck turn times are rising, widen pickup windows and warn your haulier. If rail dwell is climbing, consider whether an alternate ramp or a short-term storage option makes sense. If chassis availability is tight, confirm equipment before the container is released. These are small checks, but they prevent the classic mistake of solving the ocean leg while ignoring the land leg.
Putting the Seven Metrics to Work
Use the report as a set of pressure gauges, not a verdict. Before you change a booking, look for two or more metrics deteriorating together. One soft number may be noise; three soft numbers usually describe a real bottleneck.
- Anchorage waiting time: Is it measured arrival-to-berth, and is the trend rising?
- Vessel queue: How many ships are waiting, and what type are they?
- Berth occupancy: Is the terminal full with little slack, or simply busy?
- Berth productivity: Are moves per crane hour holding steady against the terminal’s own baseline?
- Container dwell: Are import and export dwell times rising, and is there a long tail?
- Yard utilisation: Is the yard near capacity, and are empties taking up space?
- Inland turnaround: Are truck, rail and chassis conditions adding delay after the gate?
A simple habit helps: keep a one-page note for your main ports with the date, the seven readings and the action you took. After a few weeks, you will see which numbers actually predict delays for your cargo. And if a report does not define its terms, ask. A waiting time without a start point is just a number with a nice font.
Photo: cegoh / Pixabay